echarts
https://echarts.apache.org/zh/index.html
比较火的作图库。
最简单的例子:https://echarts.apache.org/examples/zh/editor.html?c=line-simple
var echarts = require('echarts');

var chartDom = document.getElementById('main');
var myChart = echarts.init(chartDom);
var option;

option = {
    xAxis: {
        type: 'category',
        data: ['Mon', 'Tue', 'Wed', 'Thu', 'Fri', 'Sat', 'Sun']
    },
    yAxis: {
        type: 'value'
    },
    series: [{
        data: [150, 230, 224, 218, 135, 147, 260],
        type: 'line'
    }]
};

option && myChart.setOption(option);
thingsboard的widget自定义
https://thingsboard.io/docs/user-guide/contribution/widgets-development/
这里先搞定static的内容。
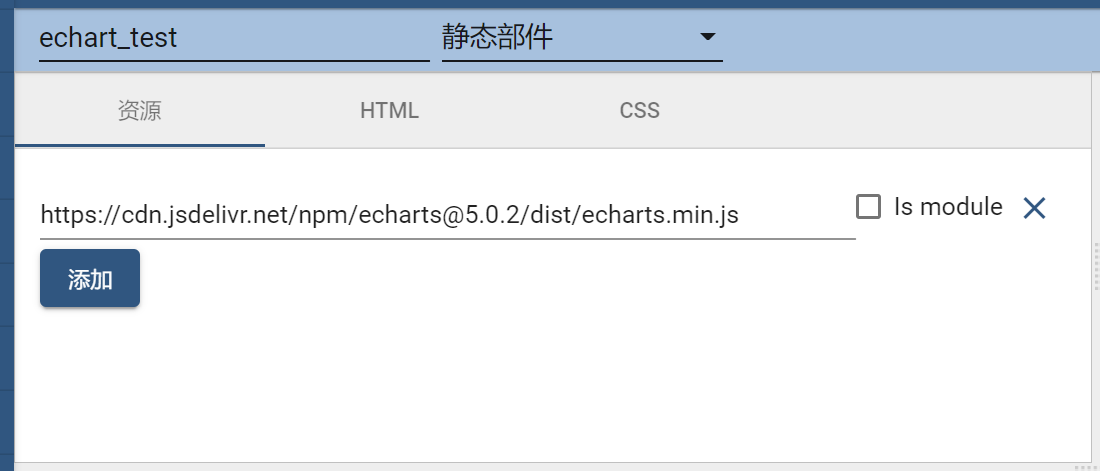
- 资源中加入echarts.min.js
我用的是:https://cdn.jsdelivr.net/npm/echarts@5.0.2/dist/echarts.min.js 设置echart.min.js的载入地址
 - HTML中可以不用管这个静态部件
- CSS我也没管
- javascript部分需要将上述echarts代码进行改写后填入
//资源中加入echarts.min.js,echarts已经可以在这个scope中使用了
self.onInit = function() {
    //console.debug(self); //chrome的console可以看到self的内容。
    //debugger; //启动浏览器的debugger进行调试
    self.ctx.place_holder = self.ctx.$container[0] //一定要加[0]
    self.ctx.chart_options = {
        xAxis: {
            type: 'category',
            data: ['Mon', 'Tue', 'Wed', 'Thu', 'Fri', 'Sat',
                'Sun'
            ]
        },
        yAxis: {
            type: 'value'
        },
        series: [{
            data: [150, 230, 224, 218, 135, 147,
                260], //data可以以后改,但是要注意scope的问题,必须放到self.ctx中或者在前面用var声明。
            type: 'line'
        }]
    };
    self.ctx.chart = echarts.init(self.ctx.place_holder);
    self.ctx.chart.setOption(self.ctx.chart_options);
    self.onResize()
}

self.onResize = function() {
    self.ctx.place_holder.width = self.ctx.width;
    self.ctx.place_holder.height = self.ctx.height;
    self.ctx.chart.resize()
}

self.onDataUpdated = function() {}
-
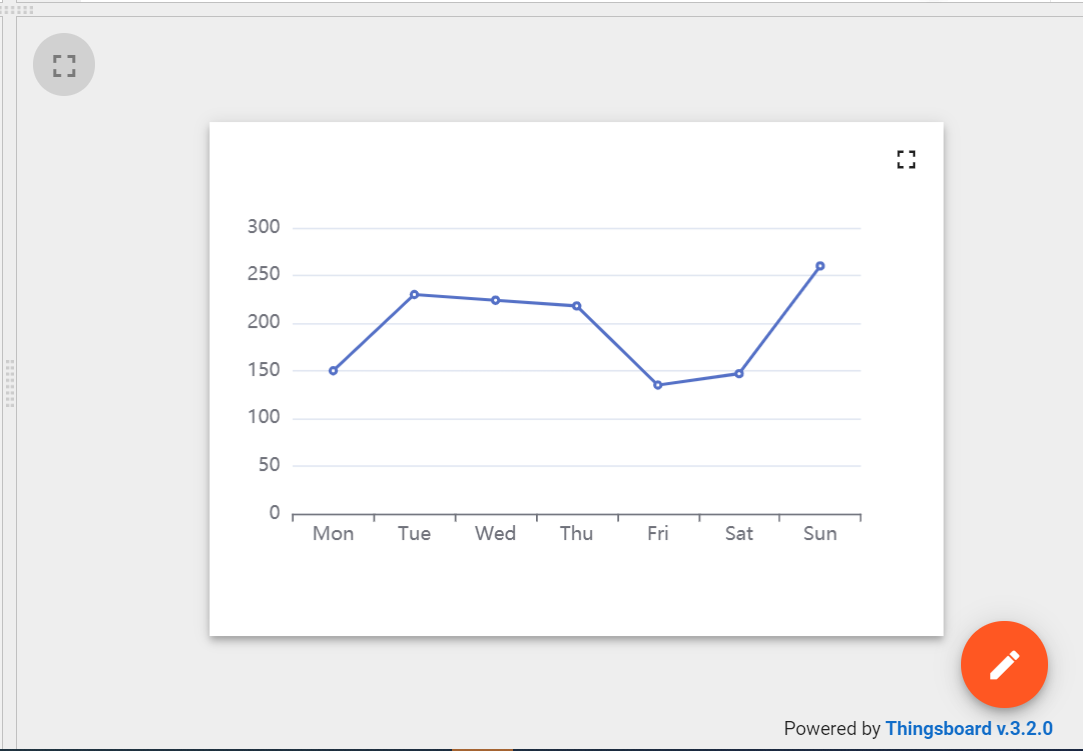
点击运行,就可以看到结果了。
 运行结果
运行结果此时可以进入编辑模式,拖动鼠标,图形是自动缩放的。
调试
console.debug(xxx); // 在浏览器的console中输出内容
//console.log(xxx); //似乎被屏蔽了,在浏览器的console中看不到输出
debugger; // 启动浏览器的debugger,在此断点,似乎还可以用vscode连接过来。
本文章来源于互联网,如有侵权,请联系删除!原文地址:2021-03-20 thingsboard自定义echarts widget(1)
物联网行业的兴起催生了一系列相关的精细领域,针对消费者个人的消费级物联网和针对企业工厂等的工业级物联网,是目前讨论最多的两个领域。而且随着智能家居商家的大力宣传,消费级物联网产品和相关技术正在广泛地为公众所知。那么工业级物联网领域又在做哪些事情呢,它跟消费级物…


